Explore your data with our NHS dashboards
The NHS is rich in data, but much of it remains fragmented across systems, delayed in reporting cycles, or too complex to translate into meaningful action. As a result, organisations often struggle to identify what is really driving variation, inefficiency, and avoidable delay.
GPLS dashboards turn complex operational data into clear, near real-time intelligence. We help NHS Trusts and Pathology Networks uncover unwarranted variation, predict demand, and improve performance across diagnostics, logistics, patient flow and financial governance.
Our dashboards don’t just report activity, they highlight bottlenecks, reveal waste, and provide decision-ready insight that supports measurable system improvement and better patient outcomes.

01. Diagnostics and Prescribing
Right-first-time testing. Reduced variation. Faster diagnosis.
We work with NHS Pathology Laboratories and Imaging teams to deliver near real-time diagnostic dashboards that support improved service performance and better patient outcomes.
Our models highlight unwarranted variation in requesting, testing, turnaround and utilisation — helping teams identify under-served populations, inappropriate demand, and avoidable repeat testing.
Through demand forecasting and variation mapping, we enable services to prioritise transformation initiatives, improve diagnostic stewardship, and optimise clinical capacity.
We also provide live transport tracking and specimen flow monitoring, ensuring reception teams and diagnostic tracks can plan workload more effectively and maintain optimal throughput across the day.
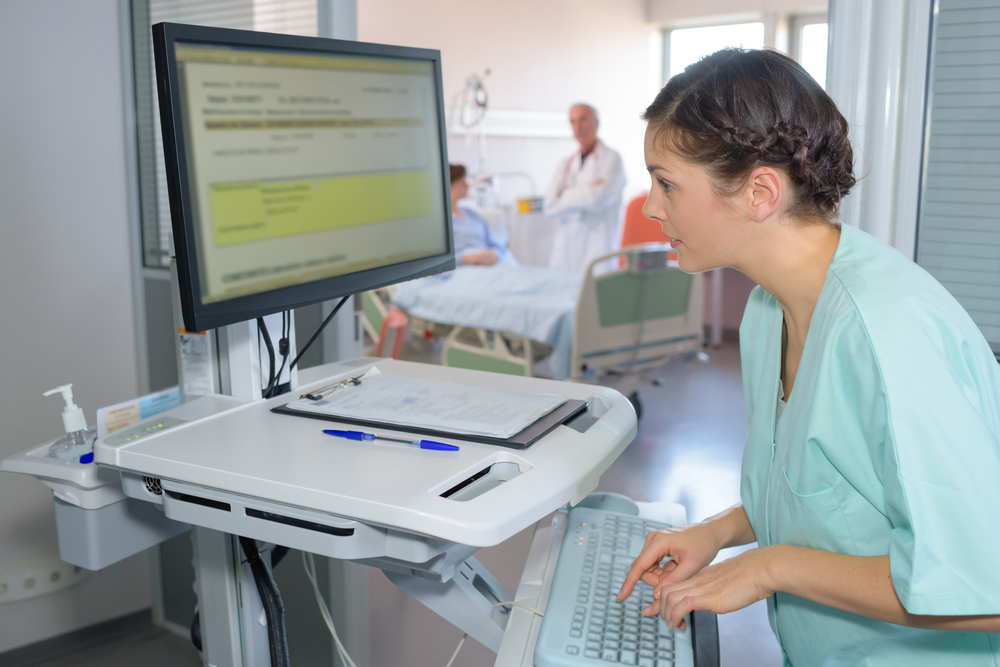
02. Patient Flow
Improving patient flow through real-time visibility.
Delayed discharge impacts patient experience, ward capacity, and operational resilience. Our dashboards provide a live view of discharge readiness and bottlenecks across wards, departments and supporting teams.
We visualise key discharge metrics including clinical sign-off, pharmacy readiness, transport coordination and care package status — enabling teams to take action earlier and reduce avoidable delay.
By improving communication between ward staff, pharmacy, transport providers and discharge coordinators, we support safer discharges, improved bed utilisation, and a smoother transition from hospital to home.
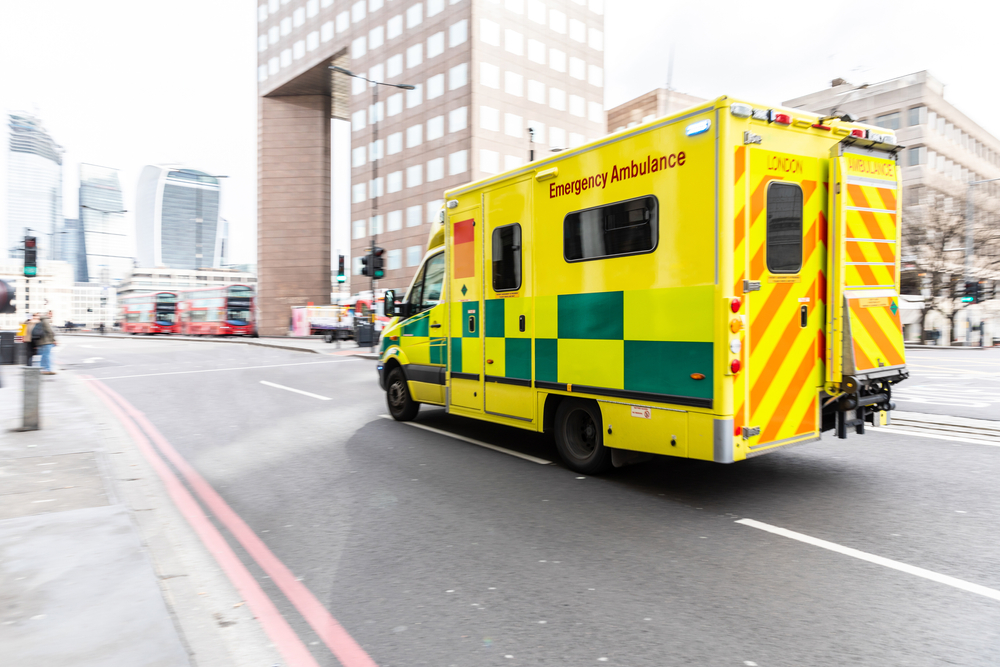
03. TRANSPORT AND LOGISTICS
Smarter routing. Reduced waste. Lower carbon.
Our Transport and Logistics dashboards provide operational insight into courier movement, delivery volumes, route efficiency and demand patterns across acute and community services.
Using real-world transport activity data, we help organisations optimise routes, reduce duplication, and improve scheduling — supporting cost reduction, improved service resilience and reduced CO₂ emissions.
Our dashboards also enable better planning for deliveries into community hubs (including smart lockers), helping clinical teams spend less time managing stock and more time delivering patient care.

04. DEMOGRAPHICS
Population insight that supports equitable access to care.
We integrate local service activity data with demographic intelligence to build dashboards that show how care is accessed across different population groups and geographies.
By linking operational data with population indicators and outcomes, we help systems identify gaps in access, variation in uptake, and inequalities in service delivery.
These insights support targeted intervention planning, improved prevention strategies, and care delivered closer to home, reducing avoidable hospital activity and improving equity across the system.

05. SUPPLIER INVOICES
Automated spend intelligence with real-time oversight.
We use AI-driven invoice analysis to turn supplier invoice data into structured intelligence, enabling organisations to track spend activity, identify duplication, and uncover hidden inefficiencies.
Our dashboards provide real-time visibility of supplier trends, purchasing patterns and anomalies, helping finance teams move from retrospective reporting to proactive cost control.
This enables quicker identification of overspend, contract leakage and avoidable expenditure, supporting more effective procurement and improved financial governance.

06. DEMAND AND CAPACITY MODELLING
System-wide modelling that turns data into planning decisions.
Our Demand and Capacity dashboards combine near real-time and historical data across diagnostics, pharmacy, transport, logistics and patient flow.
We help organisations understand how demand fluctuates, where bottlenecks form, and how capacity is being utilised across services — enabling scenario modelling and operational planning at system level.
By forecasting activity and visualising constraints, we support improved workforce planning, reduced backlogs, and more resilient service delivery across both acute and community settings.